Table of Contents
Introduction
As the days go on, we are moving toward a more modern world. And we already live in a world full of 0s and 1s. And these 0s and 1s are the future. All of these technologies are possible because of mathematics. It formulated the path to the modern world. But It has many theorems. And theorems helped us create technologies as you read this on your mobile phone or your computer. You need to know your mobile or computer is nothing but a sum of some algorithms. Algorithms make software. And software runs the hardware. On the other hand, different types of variables make an algorithm. So, to understand algorithms. We need to know about variables first. Hence let’s begin our journey with discrete and continuous Variables – Things You Need to Know.
Variables and Its significance
So, before starting our journey of discrete and continuous variables. We need to know about variables first. So what are variables in mathematics?
https://www.youtube.com/watch?v=dOr0NKyD31Q
Well, a variable can be defined as a quantity whose value changes. If we dig deep. Then we will see. Mathematicians use variables as the placeholder for varying expressions and amounts. And Algebra depends on variables. The variable has opened new doors to calculations. And if we use variables as if they were different numbers. Then we can solve a good range of problems. And that is just with a single calculation.
We can find variables as single letters in mathematics. Because in mathematics, available letters denote variables in general. And sometimes, we can see some subscripted letters or numbers after a variable. Even a word or the abbreviation of a name. Some roman symbols can also denote variables. In short, without variables, the new age of mathematics can’t be imagined. And as mathematics is the key to the modern world. We can not leave mathematics behind and step forward. Hence, both mathematics and variables are essential for our development of technologies.
Stats control our society. Nowadays, we use variables to solve many problems. Even we solve our real-life problems using variables. And variables are used in stats. If we think deeply, then we will see. Even our choice of toothpaste is based on stats. Now let’s see how stats have an impact on our life. And how discrete and continuous variables work?
A Brief History of Variables
Now, if we look back, then we will see, mathematicians use variables in different ways.
Brahmagupta was an Indian mathematician. He used different colors as unknowns in algebraic equations. He wrote a mathematical book Brahmasphutasiddhanta. In this book, we can see he used different colors as variables back in the 7th century.
However, the variables we know were first used in the 16th century. François Viète was a famous French mathematician. He used letters as variables in the 16th century. His work on new algebra was of significant importance. And maybe it is one of the most critical steps in the history of mathematics. In fact, we cannot imagine modern algebra without his work on new algebra.
But the conventional way of denoting variables is using x, y, z. Moreover, René Descartes, another famous French mathematician, invented this traditional way of using x, y, and z as variables.
Types of Variables
There are many kinds of variables. And we use variables in different ways. Hence, variables are defined as they are used. There are six common variable types. And these are:
- INDEPENDENT VARIABLES.
- DEPENDENT VARIABLES.
- MODERATOR VARIABLES.
- EXTRANEOUS VARIABLES.
- INTERVENING VARIABLES.
- CONTROL VARIABLES.
But we are talking about Discrete and continuous variables. So what kind of variables are they?
Actually, variables are also used in stats. And there are many categories in the variables of stats. So, let’s talk about some of the crucial variables of statistics.
Categorical: There are things you can categorize. And the variables that can be ordered are categorical. For example, the category “Mobile phone Brands” contains Apple and Samsung.
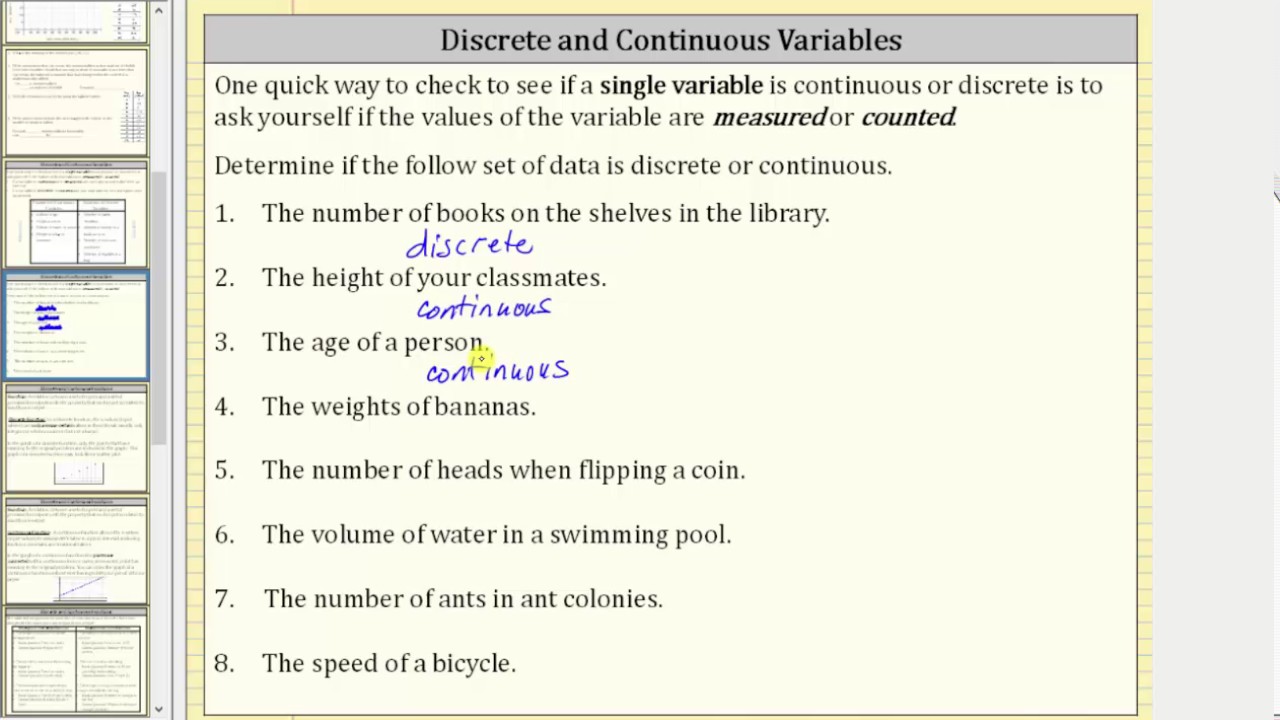
Continuous: There are some variables that we find by measuring. For example, the time it takes to go to the office, the students’ weight, etc. And these are continuous variables.
Dependent:
Dependent variables depend on independent variables. In fact, dependent variables are the results of an experiment. So, you can change an independent variable of an experiment. Then you can see the change of the dependent variable.
Discrete: We get discrete variables by counting. For example, we can count the number of students in a class. And the number of students present in a class changes every day. Hence, this number of students in a class is an example of a discrete variable.
Independent: These variables are independent. Usually, we plot these variables on the X-axis.
Lurking: Lurking variable is a hidden variable. And it affects the relationship between independent and dependent variables.
Ordinal: This is like categorical variables. But the ordinal variable has a precise order.
Discrete and Continuous Variables
Discrete and continuous variables are important types of variables in stats. And both discrete and continuous variables are numerical variables. And they have numerical values. But there are some differences between discrete and continuous variables. We get discrete variables by measuring something. On the other hand, we get continuous variables by counting something.
For example, we cannot count the weight of a person. So we have to measure it to know someone’s weight. So, if we are working on an experiment. And we need weights for several people. Then we need continuous variables.
On the other hand, if we work on a project. That requires the number of students present in a class. Or the number of apples in a tree. In short, if we can count things. Then it is a discrete variable.
Graphs for Discrete and Continuous Variables
There are many types of graphs—for example, pie charts, histograms, etc.
But before we start describing graphs for discrete and continuous variables. We need to know about two terms. And these two terms are categorical and numerical data forms. Categorical data forms are more qualitative. And less numeric. These data forms describe the qualities and characteristics of a category. This, we call it a categorical data form.
On the other hand, numerical data forms are more quantitative. Numerical data forms deal with measuring and counting a numerical value. Hence, we can see graphs for discrete and continuous variables are part of numeric data forms. In numerical data forms, we can see many kinds of graphs, such as a line graph, histogram, etc.
So, let’s discuss some examples of graphs for discrete and continuous variables.
Example of Graphs for discrete Variables.
Graphs for discrete variables are numerical data forms. And This data form deals with quantitative data. We get a discrete variable by counting something. And not measuring it. We can count the height of a person. So, let’s see a graph for discrete variables. And then discuss it. Usually, graphs for discrete variables are histograms.
It is a histogram. And this graph deals with the number of students and their height. The heights of students are on the X-axis. On the other hand, the number of students is on the Y-axis. The heights of the students are discrete variables. Hence, this graph is a perfect example of a graph for discrete variables.
And we can find more graphs like these. For example, the graph dealing with the number of trees and the number of apples in a single tree. However, we should stop here. Or we will only talk about discrete variables. And forget about continuous variables.
Example of Graphs for Continuous Variables
Continuous variables are variables that are acquired by measuring things. There are things we cannot count—for example, weight, amount of milk, etc. We cannot count these things. Hence, when we use these as variables. Then we have to use continuous variables.
So, now we talk about graphs for continuous variables.
In a graph, time in a day is on the X-axis. And distance is on the Y-axis. And this graph is a broken-line graph. Generally, the graph for continuous variables is a broken-line graph. You need to measure the distance. But you can’t count distance. Hence, this particular graph is a graph for continuous variables.
The graph is an easy way to describe. Just a glance at the graph can give many pieces of information.
Technologies, Stats, and Variables,
Variables dramatically changed many things. It changed the way of calculating algebraic mathematics. Even many scientists used variables to define many hard formulas. For example, Sir Albert Einstein used variables in his equation of relativity. In fact, not only Sir Albert Einstein. But also many famous scientists used variables in their work. Many groundbreaking inventions wouldn’t be possible. As a result, the world we are seeing would not be like this.
And all those inventions of those great scientists formed the modern world. Hence, variables have a great impact on our development of society. And that’s clear now.
And as the day goes on, we are experiencing more advanced technology. We see digital marketing. Even the theory of business changed in the modern world. And stats have a significant role in these changes. Data scientists analyze a stat report. And the analysis can show what the majority of people would love. In fact, stats show if a business will do benefit or not. In short, stats is an amazing thing. And it is making our modern world more enjoyable. People from different stages of society use stats in their daily life even though they may not understand that they are using stats.
For example, a food cart owner also uses stat before opening his cart in the morning. He thinks about which food sells the most. So he can be prepared for all the orders. And it’s also stats. Hence, we can see that we use stats without knowing it.
And variables have an important role in the matter of stats. In fact, variables are crucial for stats.
Frequently Asked Questions and Answers
First Question: Are variables important for stats?
Answer: The answer is yes. Variables are crucial to stats. In fact, without variables, stats will not have any meaning. Even there will be no graphs without variables.
Second Question: What is the main difference between numerical and categorical data forms?
Answer: Numerical data forms are more quantitative. And less qualitative. On the other hand, categorical data forms are more qualitative. But not much quantitative. So, this is the main difference between numerical and categorical data forms.
Third Question: What kind of data form are the discrete and continuous variables?
Answer: The discrete and continuous variables are based on numbers. The discrete variables are countable. But the continuous variables are measurable. Hence, the discrete and continuous variables deal with numbers. Therefore, we can understand it is an example of a numerical data form.
Fourth Question: What is the significance of graphs in stats?
Answer: The graphs show a lot of information in a small picture. You can take a glance. And understand the summary of the stat.
Conclusion
Technologies surround us in every possible way. And software runs a machine. And software is nothing but the sum of some commands. These commands are full of pf variables. Hence, variables are important for our development. One the other hand, variables are not only used in coding. But we also use variables to solve many problems. For example, we can’t solve mathematical problems without variables. Even we can not imagine algebra without variables. But we are talking about discrete and continuous variables. These are important for stats. And both discrete and continuous variables are examples of numeric data forms. Hence, we can say, discrete and continuous variables are important for a proper understanding of stats.